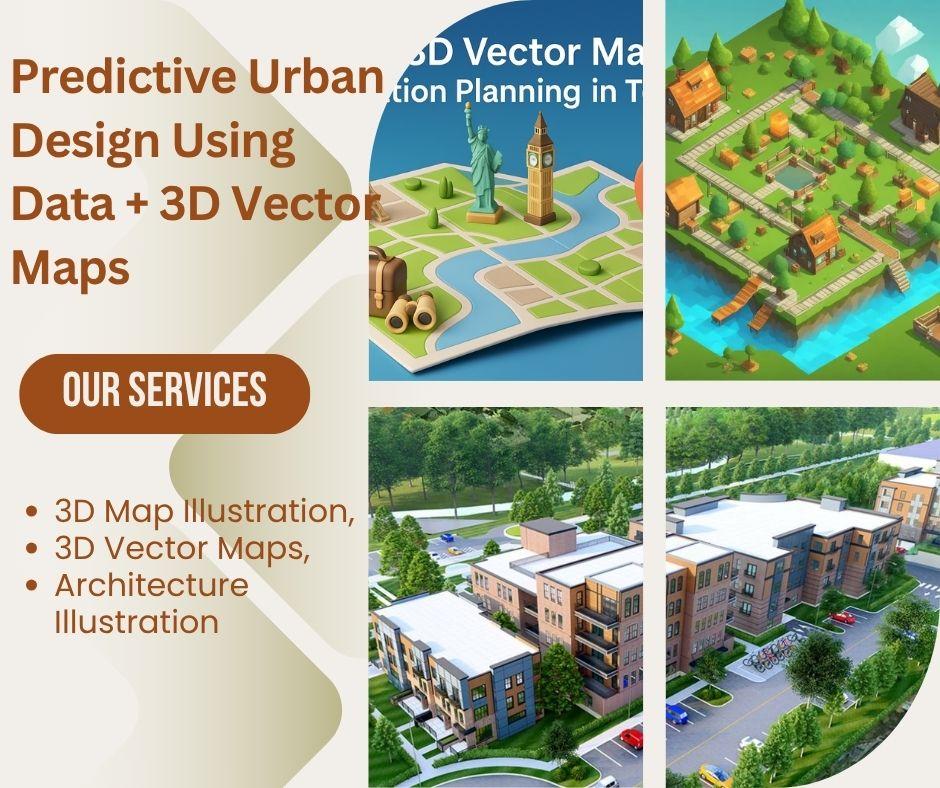
Predictive Urban Design Using Data + 3D Vector Maps
Predictive Urban Design: Reshaping Cities with Data and 3D Vector Maps
Urban planning has always been a practice steeped in informed foresight. Planners and architects have historically relied on demographic data, census reports, and educated intuition to shape the cities of tomorrow. However, in an era of unprecedented data availability and computational power, this process is undergoing a radical transformation. The powerful convergence of big data, Artificial Intelligence (AI), and intelligent 3D Vector Maps is giving rise to a new discipline: predictive urban design. This innovative approach allows urban planners to move beyond reactive problem-solving and towards proactive, evidence-based city shaping, creating more resilient, equitable, and efficient urban environments.
By integrating real-time data with a dynamic, multi-layered digital twin of a city, planners can now simulate the impact of design choices with stunning accuracy. The results can be visualized through compelling 3D Map Illustrations and detailed Architecture Illustration, making complex analyses accessible to all stakeholders.
The Foundation of Foresight: Intelligent 3D Vector Maps
At the heart of predictive urban design are 3D Vector Maps—not merely digital representations, but intelligent, geometrically precise, and semantically rich digital twins of a city.
-
Multi-layered Intelligence: Modern 3D Vector Maps go far beyond showing buildings and roads. They are a collection of layered data, including topographical contours, zoning regulations, utility infrastructure, demographic data, and real-time sensor information (e.g., traffic, air quality).
-
Semantic Accuracy: Each object in a 3D Vector Maps is not just a shape; it's a semantically tagged object with properties. A building might be tagged with its height, age, material, and energy usage data. A road might be tagged with its traffic volume and speed limits.
-
Integration with Simulation Engines: The geometric and semantic accuracy of 3D Vector Maps makes them the perfect input for powerful simulation engines.
-
Basis for Digital Twins: For smart cities, 3D Vector Maps are the essential framework upon which a comprehensive digital twin is built, enabling real-time monitoring and predictive management of city infrastructure.
The Art of the Possible: Predictive Design with Data
-
Traffic and Transit Simulation: A planner can propose a new subway station or a dedicated bus lane on the 3D Vector Maps. AI algorithms can then simulate how this change would affect traffic congestion, commute times, and public transport usage across the entire city, providing data-backed insights before a single brick is laid.
-
Generative Urban Design: By setting a series of constraints (e.g., walkability score, green space ratio, optimal daylight access), AI can explore thousands of potential design solutions for a new district, generating a range of optimal layouts that can be reviewed and refined by the planner.
-
Micro-climate Analysis: Using data on wind patterns, building heights, and sunlight paths from the 3D Vector Maps, planners can predict how new construction will affect the micro-climate of a street. They can design buildings to reduce wind tunnels, maximize solar gain in winter, or provide shade in summer.
-
Predictive Social & Economic Impact: By integrating social media sentiment and economic data from the 3D Vector Maps, planners can predict how a new public park or a revitalization project might affect local property values, business activity, and social equity, allowing them to design for positive community outcomes.
The Visual Narrative: 3D Map Illustration for Public Buy-in
Once the predictive analysis is complete, the final, most crucial step is to effectively communicate the vision to a diverse audience.
-
Showcasing the "Why": A 3D Map Illustration doesn't just show what is being built; it shows why it's being built. It can visually demonstrate the flow of a new bus route, the impact of a new park on pedestrian life, or the benefits of a redesigned waterfront.
-
Engaging Public Dialogue: By providing an immersive and interactive 3D Map Illustration, planners can facilitate more meaningful public consultations. Citizens can virtually "walk through" a proposed design, ask targeted questions, and provide specific feedback, fostering a sense of ownership in the project.
-
Building a Vision for Investors: For developers and investors, a photorealistic 3D Map Illustration is a powerful pitch tool. It can showcase the potential of a project, its integration into the urban fabric, and its long-term value in a compelling visual format.
-
Storytelling with Data: 3D Map Illustration can be used to visually tell the story of the predictive analysis. For example, a map could animate to show how traffic congestion is predicted to decrease after a new transit line is installed.
-
Phased Visualization: For long-term projects, a series of 3D Map Illustrations can depict the different construction phases, managing public expectations and demonstrating the long-term vision of the development.
Detailing the Dream: The Role of Architecture Illustration
Within the grand scope of a 3D Map Illustration, detailed Architecture Illustration zooms in on individual buildings and structures, showcasing their design quality and their role in the overall plan.
-
Aesthetic and Functional Details: Architecture Illustration can provide photorealistic renderings of new buildings, showing their proposed materials, lighting, and how they will look from a street-level perspective, which is crucial for public approval.
-
Human-Centric Design: By including human figures and details like street furniture or landscaping, Architecture Illustration can convey the scale and livability of a space, making it feel more approachable and inviting.
-
Material and Lighting Reality: The Architecture Illustration meticulously renders the intended materials and simulates realistic lighting conditions, giving stakeholders a precise understanding of the final product's appearance and how it will interact with its environment.
-
Integration into the Urban Fabric: A good Architecture Illustration will show how a new building fits within the context of its neighbors, respecting and enhancing the existing urban fabric, a key concern for many communities.
-
Showcasing Innovation: For buildings with innovative or sustainable features (e.g., green roofs, integrated solar panels), a specific Architecture Illustration can highlight these elements, demonstrating the project's commitment to cutting-edge design.
-
Bringing the Vision to Life: Ultimately, Architecture Illustration takes the high-level, data-driven plan and makes it a concrete, exciting reality, inspiring confidence in the project.
Conclusion
Predictive urban design, powered by the synthesis of real-time data and intelligent 3D Vector Maps, is an essential tool for creating the resilient and equitable cities of the future. It allows urban planners to move beyond intuition and into an era of evidence-based decision-making. By leveraging the analytical power of data and visualizing its outcomes through stunning 3D Map Illustration and detailed Architecture Illustration, planners can not only optimize for efficiency and sustainability but also effectively communicate their vision to a diverse array of stakeholders.
Categorias
Leia mais
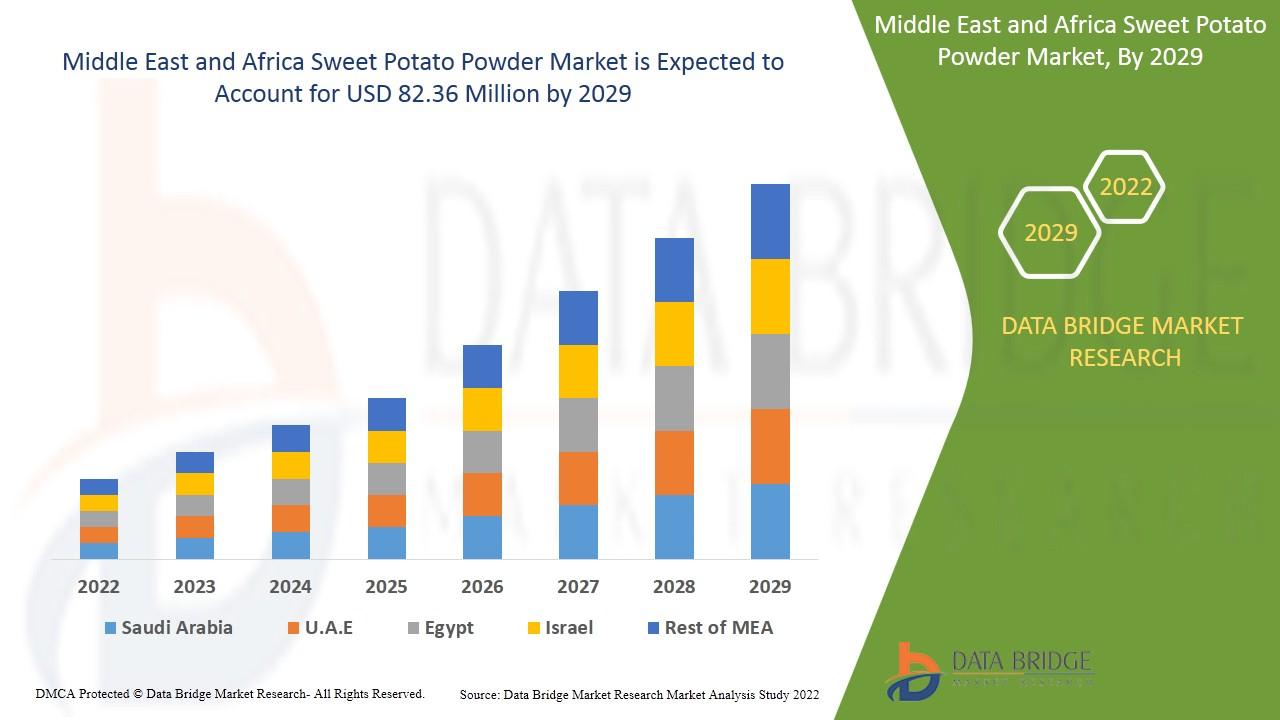
Executive Summary Middle East and Africa Sweet Potato Powder Market Data Bridge Market Research analyses that the market is growing with a CAGR of 3.2% in the forecast period of 2022 to 2029 and is expected to reach USD 82.36 million by 2029. In this Middle East and Africa Sweet Potato Powder Market report, industry trends are formulated on macro level which assists comprehend market...
Being on top of your finances is crucial for success in the fast-paced corporate environment of today. Having the best accounting software for your business may make all the difference, whether you are an entrepreneur running a growing firm or a small business owner. You can guarantee that your financial records are correct and current, improve your business performance, and expedite your...

"Executive Summary Oilfield Biocides Market : Data Bridge Market Research analyses that the oilfield biocides market will project a compound annual growth rate (CAGR) of 7.30% during the forecast period of 2021-2028. The Oilfield Biocides Market report offers meticulous investigation of current scenario of the global market, which considers numerous market dynamics. The report...
In the dynamic world of digital content, streaming has become a powerful medium for creators, brands, and businesses to engage audiences in real time. Whether you're a content creator, a coach, or an entrepreneur, live-streaming video production is a game-changer in building connection and credibility. However, not all streams are created equal. If you're wondering when to make the leap...

"Executive Summary Frozen Dumplings Market: Growth Trends and Share Breakdown The global Frozen Dumplings market was valued at USD 7.98 billion in 2024 and is expected to reach USD 14.99 billion by 2032 Frozen Dumplings Market research report is a verified source of data and information that provides a telescopic view of the current market trends, situations, opportunities and...