Turning Words into Insights: How to Analyze Non-Numeric Data for Research
In a world driven by numbers, charts, and graphs, it’s easy to overlook one of the most valuable sources of information we have: words. Numbers can tell you what is happening how many people bought a product or clicked a link. But words tell you why. They hold the stories, opinions, emotions, and motivations behind the data.
This non-numeric data, often called qualitative data, is everywhere—in customer reviews, interview transcripts, survey responses, and social media comments. The challenge isn't collecting it; it's knowing how to turn that flood of text into clear, actionable insights. Learning to analyze these words is like discovering a superpower, allowing you to understand people on a much deeper level.
What is Non-Numeric Data, Really?
Simply put, non-numeric data is any information that isn't a number. It's descriptive, contextual, and focused on human experience. Think of it as the difference between knowing a restaurant has a 4-star rating and reading a review that says, "The cozy atmosphere and friendly staff made our anniversary dinner unforgettable." Both are useful, but the second one gives you a rich, emotional picture.
Common sources of this valuable data include:
-
Open-ended survey questions: The "Is there anything else you'd like to share?" box.
-
Interview transcripts: In-depth conversations with customers or research participants.
-
Online reviews: Feedback on product pages, forums, and review sites.
-
Social media comments: Candid public opinions and discussions.
-
Support tickets: Direct communication about user problems and questions.
This information is a goldmine for anyone looking to make better decisions, whether in business, academia, or product development.
Finding the Story: The Process of Analysis
So, you’ve gathered a wealth of comments and feedback. How do you make sense of it all? You can't just put it in a spreadsheet and hit "calculate." This is where the methodical process of qualitative research analysis comes in. It’s less about math and more about being a detective sifting through clues to uncover the bigger story.
The core of data analysis in qualitative research involves finding patterns, themes, and connections within the text. While there are many formal techniques, most follow a simple, intuitive path:
-
Immerse Yourself: Start by reading through your data. Get a feel for what people are saying, the language they use, and the overall tone. Don't try to analyze just yet simply listen.
-
Start Coding: As you read through a second time, begin "coding." This means attaching short labels or tags to specific words, phrases, or sentences that represent a key idea. For example, you might code a comment like "I couldn't find the checkout button" with the label "Usability Issue."
-
Group into Themes: Once you have a list of codes, start looking for relationships. Group similar codes together into broader categories or themes. The codes "Usability Issue," "Confusing Navigation," and "Slow Loading" could all fall under the theme of "Poor Website Experience."
-
Tell the Story: Finally, connect these themes to form a coherent narrative. What does the data tell you overall? In our example, the story might be: "While customers like our products, the website's poor user experience is a significant barrier to purchase."
Modern Tools to Help You Listen Better
This process might sound time-consuming, and historically, it was. But today, technology has revolutionized how we approach it. Modern qualitative research tools are designed to streamline this workflow, helping you manage, code, and visualize your data far more efficiently.
Even more exciting is the emergence of AI qualitative research. Artificial intelligence can accelerate the process by:
-
Suggesting themes automatically.
-
Analyzing sentiment to see if comments are positive or neutral.
-
Identifying emerging topics you might have missed.
These advancements don't replace the human researcher; they empower them. By handling the heavy lifting of initial sorting and pattern recognition, AI frees you up to focus on the most important part: interpreting the insights and understanding the human story behind the data.
Conclusion
Learning to analyze non-numeric data is a game-changer. It allows you to move beyond surface-level metrics and connect with the real experiences of your audience. By turning their words into insights, you gain the clarity needed to build better products, create more effective strategies, and make decisions that are truly human-centric. The stories are waiting for you—all you have to do is listen.
FAQs
1. What is the main difference between qualitative and quantitative data?
Quantitative data is numerical and measurable (e.g., 100 sales, 5-star rating) and tells you "what" or "how many." Qualitative data is descriptive and non-numerical (e.g., customer reviews, interview answers) and tells you "why" or "how."
2. What does "coding" mean in qualitative research?
Coding is the process of labeling or tagging segments of your text data to identify and categorize key ideas, concepts, or emotions. It’s the foundational step for organizing your data and finding patterns.
3. Can AI completely automate qualitative analysis?
No, not completely. AI is a powerful tool for accelerating the process by identifying patterns and sentiment at scale. However, the critical thinking, context, and deep interpretation required to understand the nuances of human experience still require a human researcher.
4. What's a simple first step to start analyzing qualitative data?
A great first step is to gather a small, manageable set of data (like 10-15 customer reviews). Read through them and use a simple tool like a spreadsheet or even just a highlighter to start identifying and grouping recurring words and ideas. This will give you a hands-on feel for the process.
Categorii
Citeste mai mult
Review of Virmax Male Enhancement: Men lose their sexual drive and power as they age. An important thing to know about men's sexual health is that their T-levels drop as they age. People have used CBD supplements to help a lot of different health issues for a very long time. There has been a clear rise in the number of people who use herbs to improve their sexual health over the past few years....
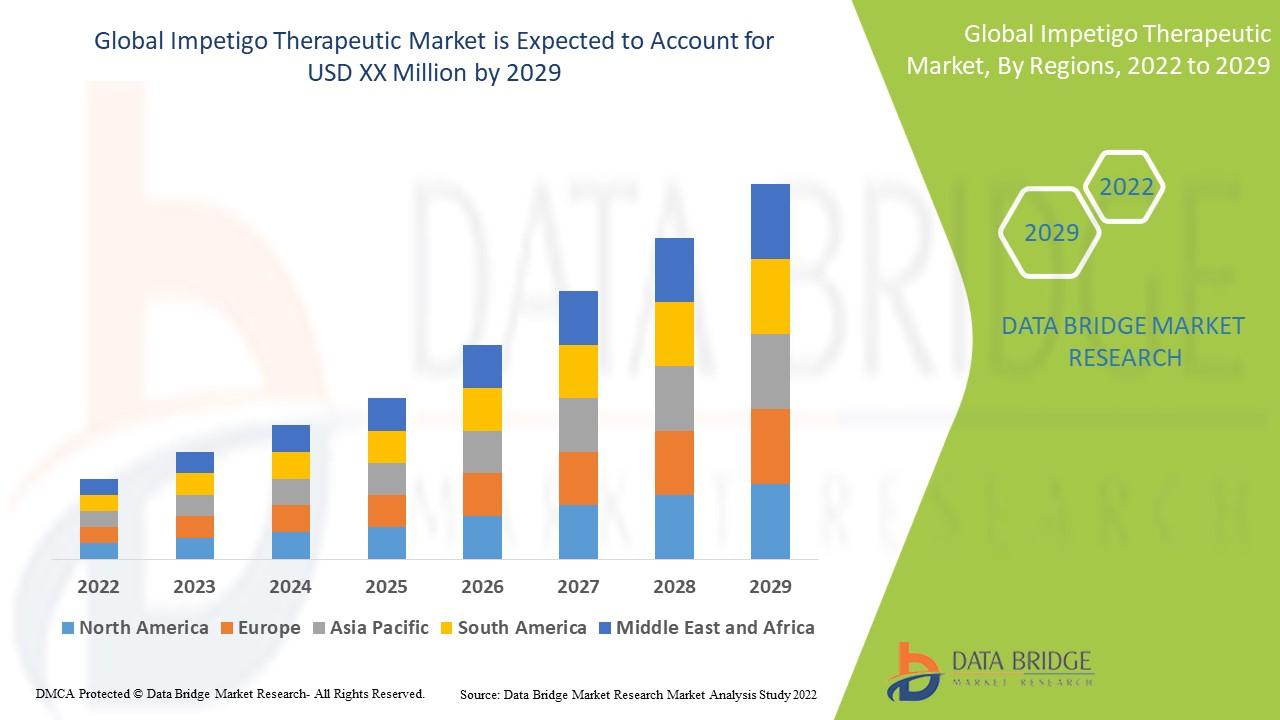
"Latest Insights on Executive Summary Impetigo Therapeutic Market Share and Size Data Bridge Market Research analyses a growth rate in the global impetigo therapeutic market in the forecast period 2022-2029. The global dilated cardiomyopathy market is tend to have a healthy CAGR in the mentioned forecast period. Objectives of the Market research are kept in mind while preparing the...
"Executive Summary Construction Aggregates Market : CAGR Value Global construction aggregates Market was valued at USD 373.5 billion in 2021 and is expected to reach USD 646.56 billion by 2029, registering a CAGR of 7.1% during the forecast period of 2022-2029. All the data and information mentioned in this Construction Aggregates Market report assists businesses take superior...
Summary of the Milk Cooling Tank Milk Cooler System Market: The Milk Cooling Tank Milk Cooler System Market plays a crucial role in the dairy industry, ensuring the quality and safety of milk from farm to table. These systems are designed to rapidly cool fresh milk to preserve its freshness, inhibit bacterial growth, and maintain its nutritional value. With the growing demand for...
❓ What is LASIK Surgery? LASIK (Laser-Assisted In Situ Keratomileusis) is a painless laser eye surgery used to correct common vision problems like nearsightedness (myopia), farsightedness (hyperopia), and astigmatism. It reshapes the cornea so light focuses correctly on the retina, helping patients reduce or eliminate the need for glasses or contact lenses. 👨⚕️ How the LASIK Procedure...